
查看博客目录
可视化ping监控:基于Python+InfluxDB+Grafana的实践
前言
作为运维工程师或网络管理员,你是否经常需要监控公司网络中各节点的连通性和延迟情况?
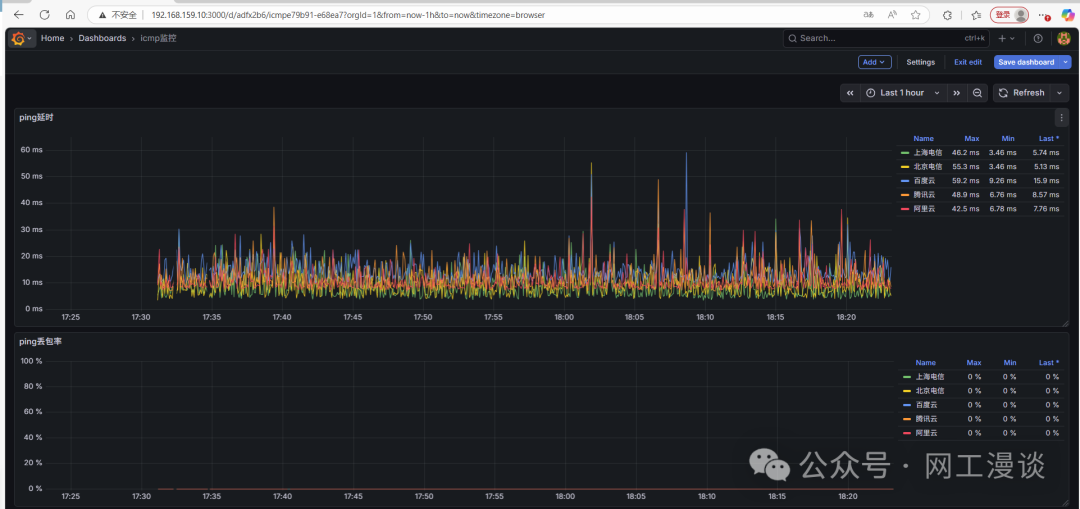
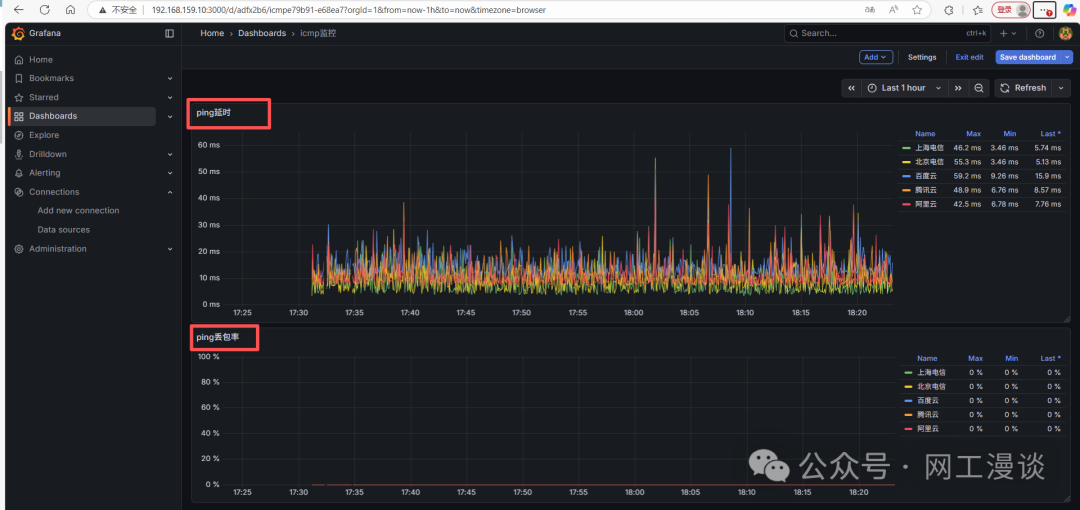
今天分享一个python+influxdb+grafana的轻量级网络监控方案,能够自动Ping你想要监控的目标IP并将丢包和延时结果可视化展示。
效果展示:
一、痛点:传统网络监控的不足
在日常网络运维中,我们经常需要: 监控各办公点、机房、云服务器的网络质量 实时了解网络延迟和丢包情况 历史数据追溯,分析网络趋势 传统的手动Ping或简单脚本存在以下问题: 数据无法持久化存储 缺乏可视化展示 无法多目标并发监控 没有历史趋势分析
二、解决方案架构设计
Python监控脚本 → InfluxDB时序数据库 → Grafana可视化展示
工作流程:
-
Python脚本并发Ping所有目标IP
-
结果写入InfluxDB时序数据库
-
Grafana读取数据并生成监控图表
我下面的案例中 python脚本、influxdb、grafana 都部署在一台机器上
三、安装influxdb
以centos为例:
# 下载 RPM 包
wget https://dl.influxdata.com/influxdb/releases/influxdb-1.8.10.x86_64.rpm

# yum 安装 InfluxDB
yum install influxdb-1.8.10.x86_64.rpm

# 启动 InfluxDB
systemctl start influxdb.service
systemctl enable influxdb.service
四、完整代码
3.1 目录结果
├── dst_ip.json  # 需要监控的目标 IP
└── ping.py      # ping 脚本
3.2 dst_ip.json文件内容格式参考
[
  {"ISP": "阿里云", "IP": "223.5.5.5"},
  {"ISP": "腾讯云", "IP": "119.29.29.29"},
  {"ISP": "百度云", "IP": "180.76.76.76"},
  {"ISP": "上海电信", "IP": "202.96.209.5"},
  {"ISP": "北京电信", "IP": "202.96.199.133"}
]
优势:增删监控目标无需修改代码,只需更新配置文件
3.3 监控脚本
import json
import os
import threading
import time

from influxdb import InfluxDBClient
from influxdb.exceptions import InfluxDBClientError
from ping3 import ping


# =============== 配置变量(可修改) ===============
MONITORING_SOURCE = "office"       # 监控源名称
INFLUXDB_HOST = "127.0.0.1"         # InfluxDB 服务器地址
INFLUXDB_PORT = 8086                # InfluxDB 服务器端口
INFLUXDB_TIMEOUT = 3                # InfluxDB 连接超时时间
DATABASE_NAME = "icmp_Monitor"      # InfluxDB 数据库名称
IP_CONFIG_FILE = "dst_ip.json"      # IP 列表配置文件
PING_TIMEOUT = 1                     # Ping 超时时间(秒)
MAIN_LOOP_INTERVAL = 5               # 主循环间隔(秒)
THREAD_JOIN_TIMEOUT = 2              # 线程等待超时(秒)


def create_influx_client():
    """创建 InfluxDB 连接,并确保数据库存在。"""
    try:
        client = InfluxDBClient(
            host=INFLUXDB_HOST,
            port=INFLUXDB_PORT,
            timeout=INFLUXDB_TIMEOUT,
        )
        databases = client.get_list_database()
        if not any(db["name"] == DATABASE_NAME for db in databases):
            print(f"数据库 '{DATABASE_NAME}' 不存在,正在创建...")
            client.create_database(DATABASE_NAME)
        client.switch_database(DATABASE_NAME)
        return client
    except Exception as error:
        print(f"创建 InfluxDB 连接失败: {error}")
        return None


def get_iplist():
    ip_file = os.path.join(os.getcwd(), IP_CONFIG_FILE)
    try:
        with open(ip_file, encoding="utf-8") as file:
            return json.load(file)
    except FileNotFoundError:
        print(f"配置文件不存在: {ip_file}")
        return []
    except json.JSONDecodeError as error:
        print(f"JSON 解析错误: {error}")
        return []
    except Exception as error:
        print(f"读取配置文件错误: {error}")
        return []


def write_to_influx(client, dst_isp, influx_stamp, ping_rtt, ping_loss):
    """写入数据到 InfluxDB。"""
    if client is None:
        return False

    json_body = [{
        "measurement": MONITORING_SOURCE,
        "tags": {"dst_isp": dst_isp},
        "time": influx_stamp,
        "fields": {"rrt": ping_rtt, "loss": ping_loss},
    }]

    try:
        result = client.write_points(json_body)
        if result:
            print(f"数据成功写入 InfluxDB: {dst_isp}, RTT: {ping_rtt}ms, Loss: {ping_loss}%")
        return result
    except InfluxDBClientError as error:
        print(f"写入 InfluxDB 失败: {error}")
        return False
    except Exception as error:
        print(f"写入数据异常: {error}")
        return False


def ping_host(dst_isp_ip, dst_isp, influx_stamp, client):
    """Ping 目标主机并记录结果。"""
    try:
        ping_result = ping(dst_isp_ip, timeout=PING_TIMEOUT, unit="ms")
        if ping_result is None or ping_result is False:
            ping_loss = 100
            ping_rtt = 0
            print(f"无法 ping 通: {dst_isp_ip} ({dst_isp}) 丢包率: {ping_loss}%")
        else:
            ping_loss = 0
            ping_rtt = float(ping_result)
            print(f"ping 通: {dst_isp_ip} ({dst_isp}) 延迟: {ping_rtt:.2f}ms")
        write_to_influx(client, dst_isp, influx_stamp, ping_rtt, ping_loss)
    except Exception as error:
        print(f"ping {dst_isp_ip} 时出错: {error}")


def main_loop():
    """主监控循环。"""
    client = create_influx_client()
    if client is None:
        print("无法连接到 InfluxDB,程序退出")
        return

    try:
        while True:
            loop_start_time = time.time()
            influx_stamp = int(loop_start_time * 1_000_000_000)
            threads = []

            for item in get_iplist():
                dst_ip = item.get("IP")
                dst_isp = item.get("ISP")
                if not dst_ip or not dst_isp:
                    print(f"跳过无效记录: {item}")
                    continue

                thread = threading.Thread(
                    target=ping_host,
                    args=(dst_ip, dst_isp, influx_stamp, client),
                )
                thread.daemon = True
                thread.start()
                threads.append(thread)

            for thread in threads:
                thread.join(timeout=THREAD_JOIN_TIMEOUT)

            runtime = time.time() - loop_start_time
            sleep_time = max(MAIN_LOOP_INTERVAL - runtime, 0.1)
            if runtime > MAIN_LOOP_INTERVAL:
                print(f"警告: 循环执行时间({runtime:.2f}s)超过 {MAIN_LOOP_INTERVAL} 秒")
            time.sleep(sleep_time)
    except KeyboardInterrupt:
        print("收到中断信号,程序退出")
    except Exception as error:
        print(f"主循环异常: {error}")
    finally:
        client.close()
        print("连接已关闭")


if __name__ == "__main__":
    main_loop()
五、安装grafana并添加influxdb数据源
5.1 安装grafana
grafana下载链接:https://grafana.com/grafana/download?pg=get&plcmt=selfmanaged-box1-cta1
以 CentOS 为例:

# yum 安装
yum install -y https://dl.grafana.com/grafana-enterprise/release/12.3.1/grafana-enterprise_12.3.1_20271043721_linux_amd64.rpm

# 启动 Grafana
systemctl start grafana-server
systemctl enable grafana-server
5.2 添加influxdb数据源
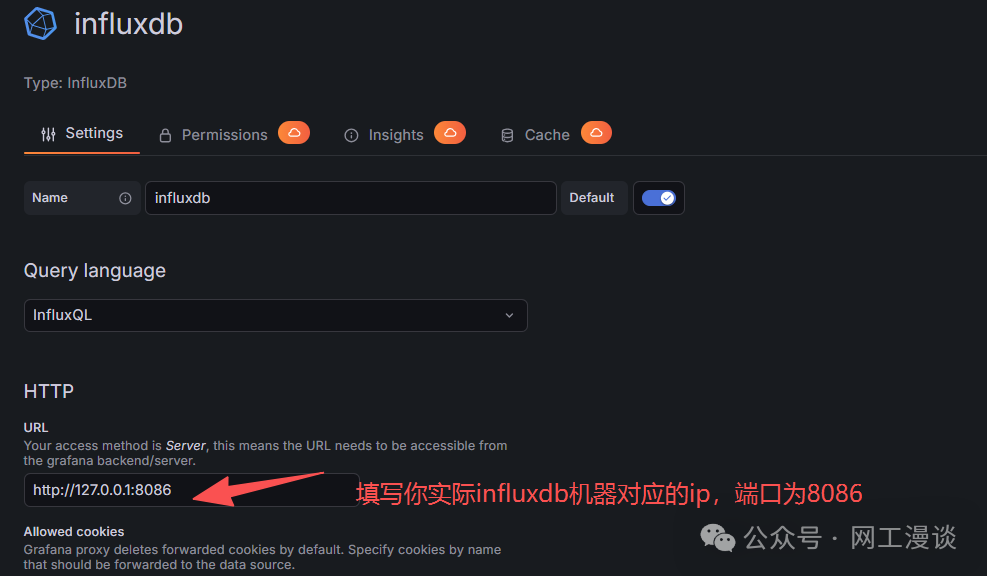
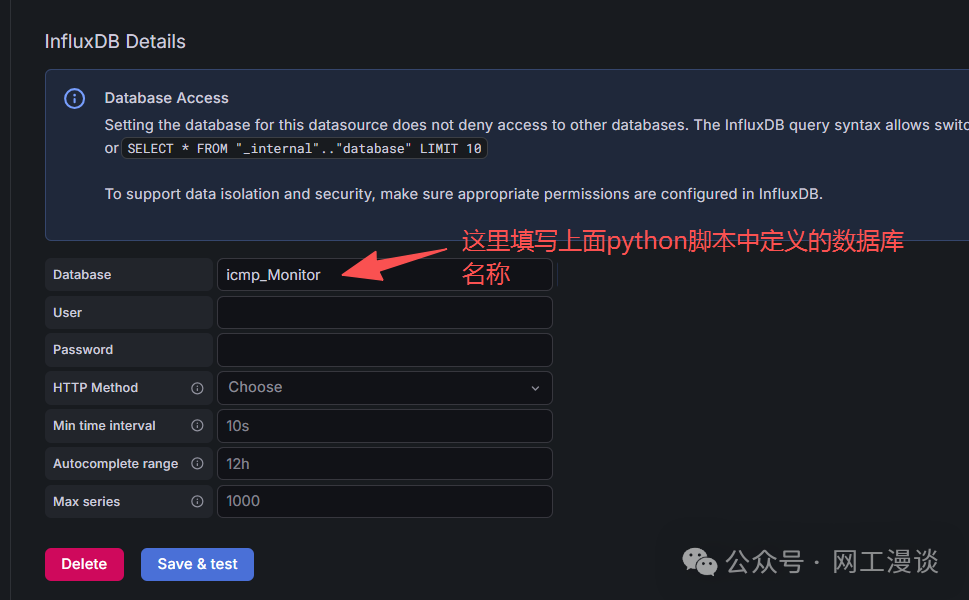
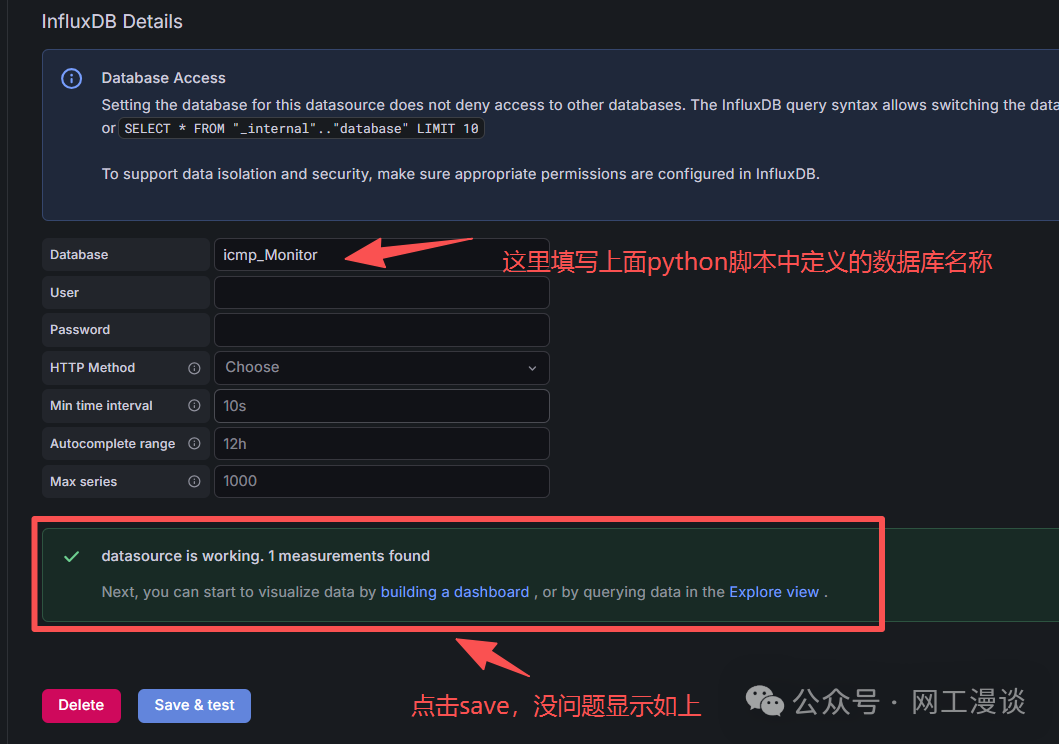
最后在使用influxdb数据源添加图形即可,得到如下效果:
往期推荐:
别只会 Ping!网络工程师的10款排障诊断工具(建议收藏)
保姆级教程:10分钟搭建Oxidized,实现网络设备配置自动备份